

Legacy BBI Method
In Garmin's initial legacy BBI system, the measurement of the time between heartbeats was set up to remain functional, even if the signal quality from the wristwatch was not ideal. This was aimed at ensuring that heartbeat measurements could be continuously taken without interruption. However, to achieve this, the system had to apply additional filtering to the signal it received - which had the unintentional downside of reducing the system's capacity to capture the full range of heart rate variability [2]. Specifically, it could sometimes filter out higher frequency components of the heart rate - a component needed for accurately calculating RMSSD, a key HRV indicator.
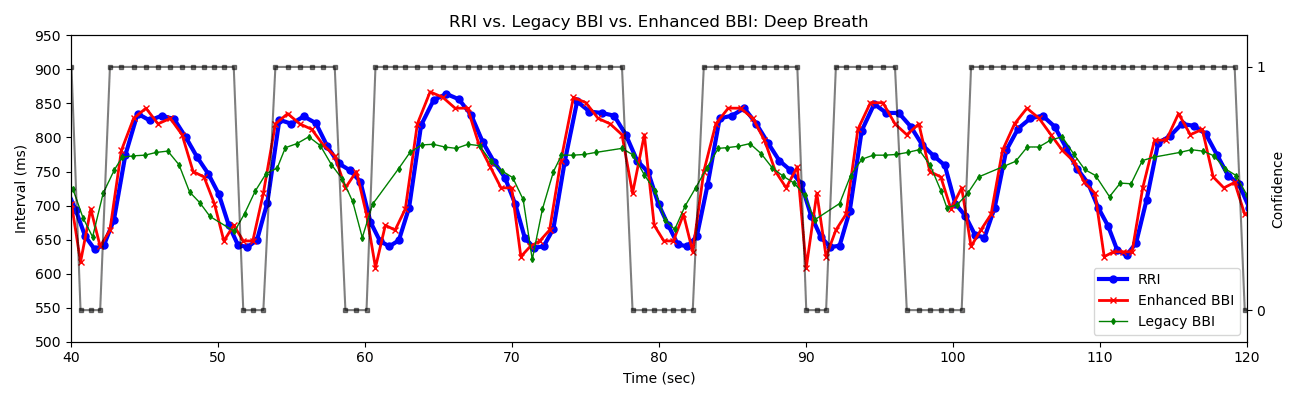
Figure 1 shows a synchronized comparison between RR intervals (RRI) in blue and legacy BBI in green. The RRI was measured by Movesense ECG (the “Gold Standard” for interbeat intervals), while the legacy BBI (and Enhanced BBI) were acquired by Garmin wearable PPG devices. The measurements were conducted during slow, deep breathing, with the expectation of maximizing respiratory sinus arrhythmia (RSA). As shown, the legacy BBI time series has an attenuated RSA due to the filtering out of higher-frequency heart rate components.
Enhanced BBI Method
Garmin then developed a new method called Enhanced BBI to improve the heartbeat signal processing. This new method keeps more of the original heartbeat information intact, allowing for more accurate detection of the higher frequency components of HRV.
Moreover, a new feature - a confidence score - was introduced. This score is like a simple yes (ONE) or no (ZERO) signal that tells researchers how much the measurement of each heartbeat can be trusted. A score of ONE means the measurement is likely accurate; while a score of ZERO indicates that the measurement might not be as reliable. The example is shown as the black line in Figure 1.
Garmin devices mark beats as low confidence due to at least one of three reasons: (1) motion artifact, (2) poor signal quality, or (3) abnormally high heart rate variability (HRV). Motion is detected through the three-axis accelerometer, leading to low-confidence beats when the acceleration exceeds a predetermined threshold. When this occurs, the device will decline to provide a beat measurement at all, generating a gap in data. Poor signal quality can arise from improper fit of the device or low blood flow, impacting signal capture. In this case, BBI data may be generated but is at risk of being unreliable. Even with good signal quality, abnormally high HRV (significantly shorter or longer than typical beats) will also trigger low confidence marks.
As seen in Figure 1, Enhanced BBI strikes a safe balance regarding inclusion/exclusion of high HRV – it eliminates signals with abnormally high HRV while still maintaining the respiratory sinus arrhythmia (RSA) observable in both the RRI and enhanced BBI signals –addressing the filter-related limitations observed in the legacy version. Moreover, the figure plots the confidence values from the Enhanced BBI feature, offering insights into signal quality and indicating when the signal might be compromised. These confidence markers enable researchers to identify potential discrepancies between the enhanced BBI and RRI, allowing for tailored adjustments in their data analysis to meet specific research objectives.
Why Enhanced BBI Matters
The Enhanced BBI method is particularly unique (for consumer wearables) because it gives researchers detailed information for every single heartbeat, rather than just average or summary statistics. It does not automatically dismiss any data as inaccurate (which some systems do); instead, it flags data that might not be reliable, leaving it up to the researchers to decide how to use it.
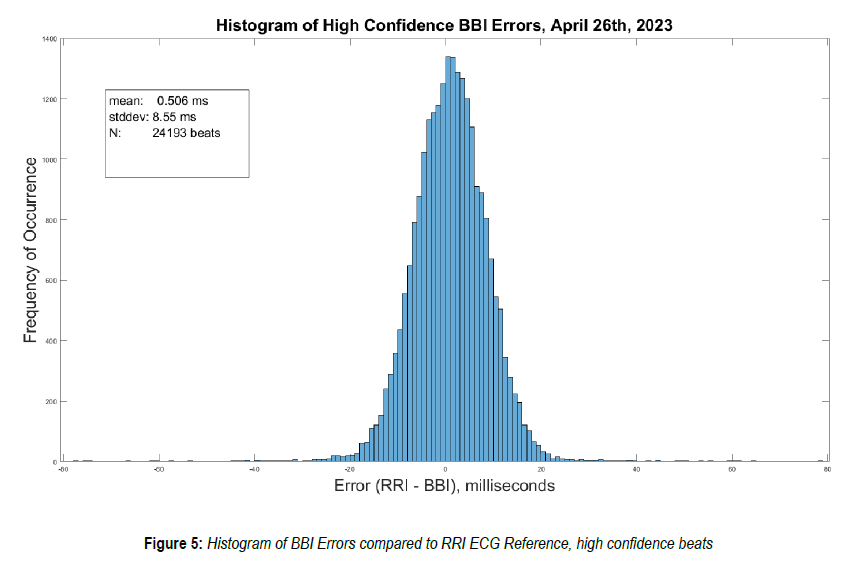
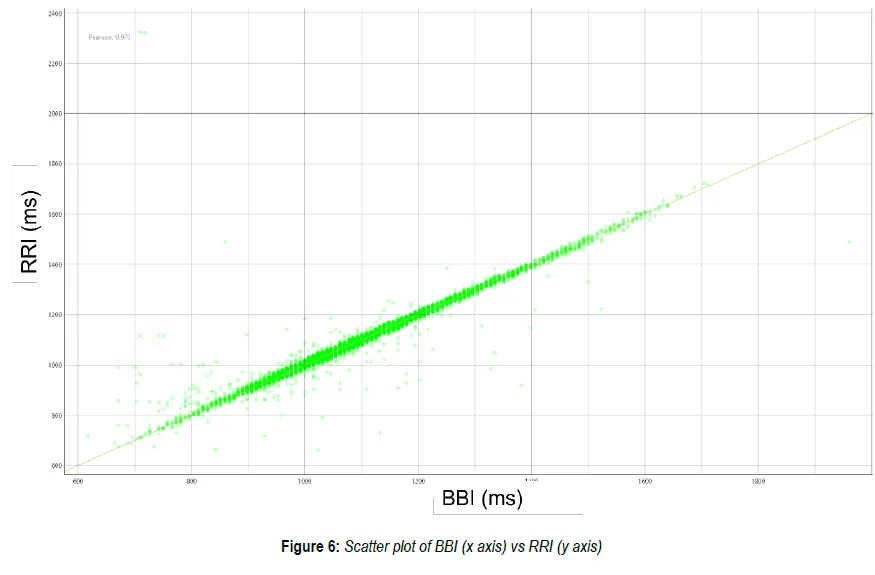
As shown in Figure 1, and also based on Garmin’s white paper, the enhanced BBI performs exceedingly well using ECG-based RRI as a ground-truth reference [1]. Figure 2 shows the histogram of the difference between high-confidence BBI and RRI among 2,4193 matched beats. The mean RRI is 1078.6 ms; while the mean and standard deviation of the differences between BBI and RRI are 0.5 and 8.6 ms, respectively. The result implies that the error of 95% of the BBI points is within ±20ms, around 2% error in this case. Figure 3 shows the scatter plot of RRI vs. high-confidence BBI. The Pearson correlation coefficient is 0.975, which implies that the high-confidence BBI is highly consistent with RRI.
Recommendations for More Precise Analysis
To achieve precise analysis, it is crucial for researchers to record beat-to-beat intervals (BBI) under controlled conditions (minimal physical movement, good watch fit on the wrist) to reduce the chances of obtaining low-confidence readings, which may hinder the interpretation of data. After collecting the data, it's advisable to discard BBI readings that are marked with zero confidence. However, this practice might lead to gaps in the data, which could affect the reliability of traditional Heart Rate Variability (HRV) measures, such as SDNN and High Frequency HRV. For those skilled in interpolation techniques, a solution may involve removing BBIs with low confidence and then filling in the resulting data gaps.
As an alternative strategy, researchers might choose to include BBIs of low confidence in their analysis, as long as they represent a small fraction of the overall dataset. We recommend setting a limit where low confidence BBIs do not exceed 20% of the data, equating to no more than 60 seconds of low-confidence BBIs within any 5-minute segment of BBI data for HRV calculations.
These initial guidelines are intended to help researchers make the most of high-confidence BBI data to increase the accuracy of their studies. Stay tuned for our forthcoming article which will offer additional guidelines on this topic.
References
[1] Garmin, Garmin Enhanced BBI. Available at: https://www8.garmin.com/garminhealth/news/Garmin-Enhanced-BBI_Final.pdf [accessed March 1, 2024]
[2] F. Theurl et al., "Smartwatch-derived heart rate variability: a head-to-head comparison with the gold standard in cardiovascular disease," Eur Heart J Digit Health, vol. 4, no. 3, pp. 155-164, 2023, doi: 10.1093/ehjdh/ztad022.
[3] F. Shaffer and J. P. Ginsberg, "An Overview of Heart Rate Variability Metrics and Norms," Front Public Health, vol. 5, p. 258, 2017, doi: 10.3389/fpubh.2017.00258.

Francis is a research Lead at Labfront, responsible for data validation and analysis. He is interested in applying physics or math to medical research.

Dr. Ahn is an internal medicine physician with a background in physics/engineering and physiological signal analyses. He is the Chief Medical Officer at Labfront and an Assistant Professor in Medicine & Radiology at Harvard Medical School. Dr. Ahn is passionate about democratizing health sciences and exploring health from an anti-disciplinary perspective.

Han-Ping is the senior research lead (and chief plant caretaker) at Labfront, specializing in physiological data analysis. An alumnus of the BIDMC/Harvard's Center for Dynamical Biomarkers, Han-Ping uses his PhD in electrophysics to help Labfront customers convert raw physiological data into health insights. He does his best Python coding while powered by arm massages from his spiky-tongued cat, Pi.
.svg)


.webp)


.svg)